
Standard Error Calculator (SE Calculator) Free & Fast
Use our free Standard Error Calculator to find SE instantly. Learn the formula, step-by-step method and when to use standard error vs standard deviation.
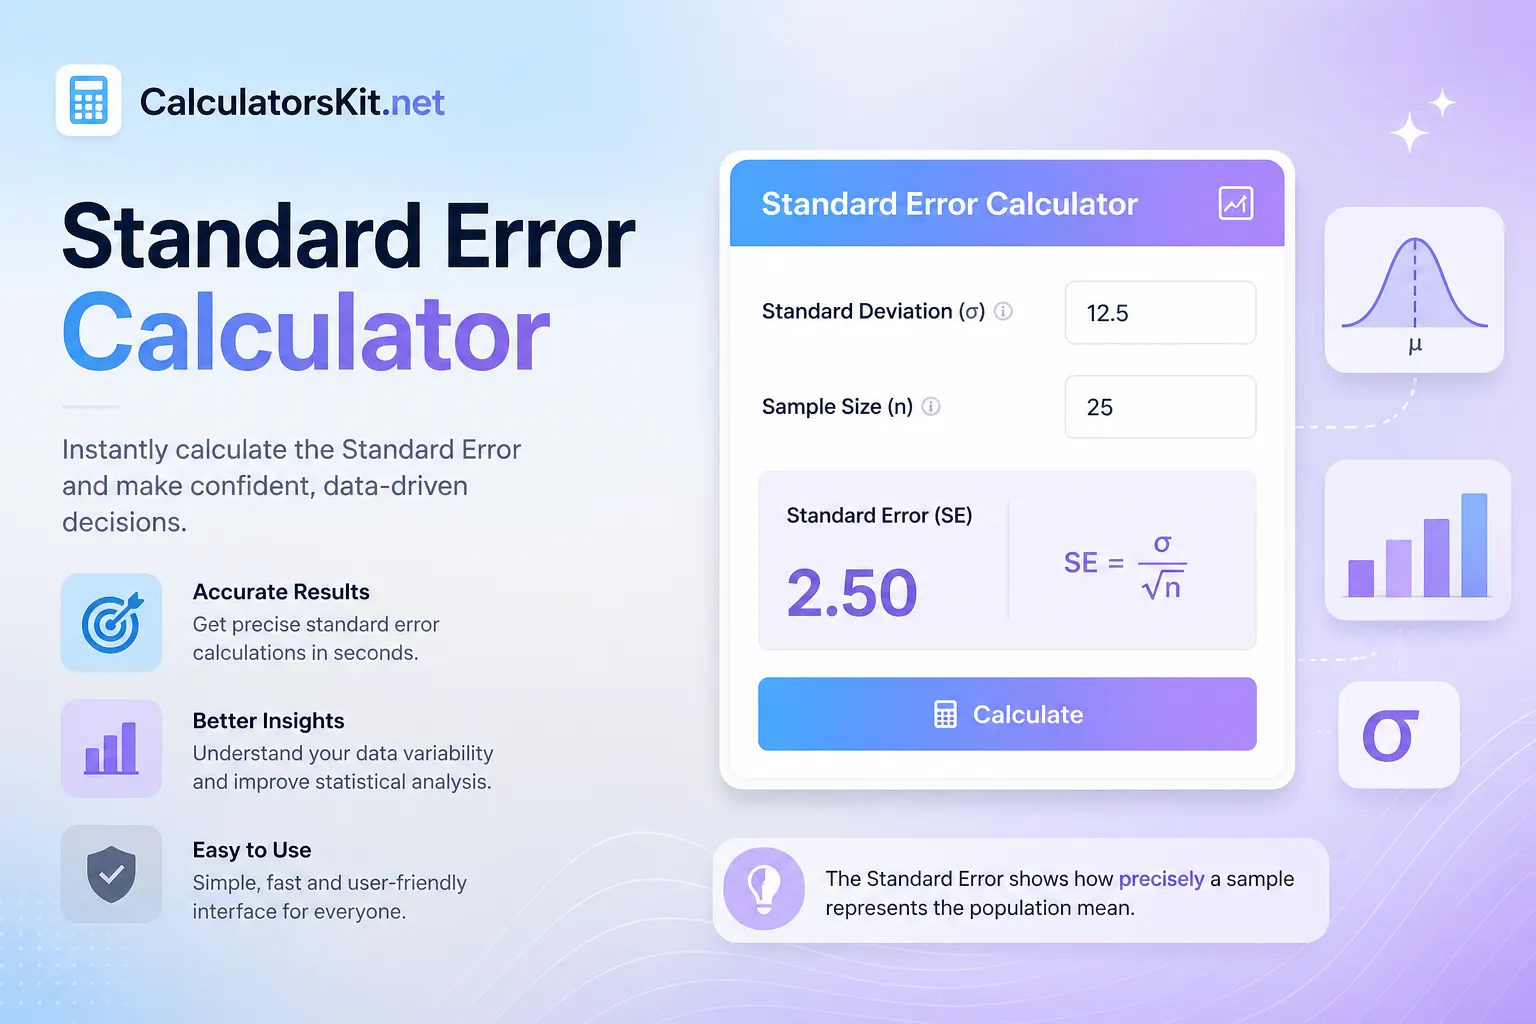
A Standard Error Calculator computes the standard error of a sample to measure how precisely your sample estimates the true population mean. Enter your dataset, and the calculator instantly divides the sample standard deviation by the square root of the sample size (SE = s / √n).
Every researcher, student, and data analyst eventually faces the same challenge: how confident should you be in a sample mean? Whether you are running a clinical trial, analysing survey data, or grading student performance, a single sample rarely tells the whole story. That is exactly where a Standard Error Calculator (SE Calculator) Free & Fast becomes indispensable.
Standard error quantifies the variability of sample means around the true population mean. A small standard error signals high precision; a large one flags unreliable estimates. In this ultimate guide, you will learn exactly what standard error is, how the standard error formula works, when to use an online statistics calculator, and how to interpret results with confidence.
By the end, you will have a complete, practical toolkit with no statistics degree required.
What Is Standard Error? A Clear Definition
Standard error (SE) is the standard deviation of the sampling distribution of a statistic, most commonly the sample mean. In plain terms, it estimates how much the sample mean (x̄) would vary if you repeated the same study many times on different random samples drawn from the same population.
That role belongs to standard deviation. Standard error instead measures the precision of your estimate of the population, a critical distinction that confuses many first-time users of a statistics calculator online.
Why Standard Error Is Critical in Research
Standard error forms the backbone of confidence interval calculations.
Hypothesis tests (t-tests, z-tests) rely directly on standard error.
Smaller sample sizes produce larger standard errors — meaning less reliable estimates.
Scientific calculator journals routinely require authors to report standard error or confidence intervals alongside means.
The Standard Error Formula Explained
The standard error formula is elegantly simple. For a sample mean, the standard error calculator applies the following equation:
SE = s / √n
Where s = sample standard deviation · n = sample size
How to Calculate Standard Error Manually
Collect your sample data (e.g., test scores: 78, 82, 91, 74, 88).
Calculate the sample mean: (78 + 82 + 91 + 74 + 88) / 5 = 82.6
Calculate the sample standard deviation using: s = √[Σ(xᵢ − x̄)² / (n−1)]
For the example above: s ≈ 6.58, n = 5, so SE = 6.58 / √5 ≈ 2.94. This means the sample mean of 82.6 has a standard error of approximately 2.94 a useful precision indicator.
Common Mistake
Many users confuse dividing by n versus n−1 in the standard deviation step. A sample standard error calculator uses (n−1) Bessel's correction to produce an unbiased estimate. Population standard deviation uses n. Always confirm which formula your calculator applies before interpreting results.
What a Good Standard Error Calculator Should Include
Automatic detection of sample size (n) from entered data
Display of intermediate results (mean, standard deviation, SE)
Confidence interval output at 90%, 95%, and 99% levels
Support for large datasets (100+ values) without performance lag
Mobile-friendly layout for on-the-go statistical work
Clear labelling distinguishing the sample SE from the population SE
Standard Deviation vs Standard Error: Key Differences
The terms standard deviation and standard error appear together constantly, yet they measure fundamentally different things. Confusing the two produces misleading reports and flawed conclusions. Here is a direct comparison:
Estimating the reliability of the population mean
Key rule of thumb: Use standard deviation when describing your sample data. Use the standard error when making inferences about the population from which the sample was drawn.
Standard error always decreases as sample size grows because larger samples produce more reliable mean estimates. Standard deviation calculator does not necessarily shrink with larger samples; it reflects inherent data variability.
When to Use Standard Error in Real-World Analysis
A sample standard error calculator proves valuable across dozens of professional and academic contexts. The most common use cases include:
Medical and Clinical Research
Clinical trials report treatment effects with standard error to communicate measurement precision. A drug that lowers blood pressure by 8 mmHg (SE = 0.6 mmHg) is far more convincingly reported than one with SE = 4.2 mmHg, even if the mean effect is identical.
Social Science and Survey Data
Survey researchers use standard error to quantify polling uncertainty. A political poll reporting 52% support (SE = 1.1%) provides tighter confidence intervals than one with SE = 4.0%, directly affecting how results are interpreted by decision-makers.
Finance and Economics
Economists estimate population parameters, average household income, inflation rates, and return on investment from sample data. Standard error anchors the reliability of every such estimate.
Quality Control and Manufacturing
Production lines sample manufactured units to estimate defect rates. Standard error determines the confidence interval around the defect rate estimate, informing go/no-go decisions without testing every unit produced.
Real Calculation
The following walkthrough demonstrates how a Standard Error Calculator (SE Calculator) Free & Fast streamlines real analytical work, using a realistic dataset.
Scenario: A university instructor wants to estimate the average exam score for a class of 200 students. The instructor randomly selects 25 students and records their scores.
Sample scores (n = 25):
74, 88, 62, 91, 77, 83, 69, 95, 71, 80, 86, 58, 79, 92, 65, 73, 88, 76, 84, 67, 90, 71, 78, 85, 63
Step 1: Calculate the mean: Sum of all 25 scores = 1,944. Mean (x̄) = 1,944 / 25 = 77.76
Step 2: Calculate sample standard deviation: Using the (n−1) formula, s ≈ 10.28
Step 3 :Apply the SE formula: SE = 10.28 / √25 = 10.28 / 5 = 2.056
Interpretation: The sample mean of 77.76 carries a standard error of approximately 2.06. A 95% confidence interval is 77.76 ± (1.96 × 2.06) = [73.7, 81.8]. The instructor can state with 95% confidence that the true class average lies between 73.7 and 81.8.
This entire calculation, which takes roughly 8 minutes manually, completes in under 5 seconds using a free online Standard Error Calculator.
Conclusion:
Standard error is one of the most powerful and most frequently misunderstood statistics in quantitative research. Whether you are a student computing exam score reliability, a researcher reporting clinical trial precision, or a data analyst validating survey results, a Standard Error Calculator (SE Calculator) Free & Fast transforms a multi-step manual process into an instant, accurate result.
The formula SE = s / √n is simple. Its implications are profound. A smaller standard error means higher confidence in your estimate. A larger standard error is a signal to collect more data, refine your sampling method, or reconsider your conclusions before publishing or presenting.
Use the free math calculator above to enter your dataset, compute your standard error, and build confidence intervals that accurately reflect the precision of your research.
FAQs:
What is a standard error calculator used for?
A standard error calculator computes the standard error of a sample to measure how precisely a sample estimates the population mean. Researchers, students, and data analysts use standard error calculators to build confidence intervals, run hypothesis tests, and report statistical precision in academic and professional work.
How do I calculate standard error from standard deviation?
Divide the sample standard deviation (s) by the square root of the sample size (n): SE = s / √n. For example, if s = 12 and n = 36, then SE = 12 / 6 = 2.0. Most online standard error calculators perform this step automatically once you enter your data values.
What is the difference between standard deviation and standard error?
Standard deviation measures the spread of individual data points within a sample. Standard error measures the precision of the sample mean as an estimate of the population mean. Standard error always shrinks as sample size grows; standard deviation reflects inherent data variability and does not necessarily decrease with larger samples.
Why does the standard error decrease with larger sample sizes?
Because the formula SE = s / √n divides by the square root of n, increasing n reduces SE mathematically. Larger samples average out individual variation more effectively, producing samples that cluster more tightly around the true population mean, hence, greater precision and a smaller standard error.
Is a free online standard error calculator accurate?
Yes, reputable free online SE calculators apply the correct sample standard deviation formula (using n−1 in the denominator) and then divide by √n. Always verify that the calculator uses n−1 (Bessel's correction) rather than n, as the latter would underestimate the population standard deviation and produce a biased standard error.
Can I use a standard error calculator for small samples?
Yes, but with caution. For small samples (n < 30), the t-distribution provides more accurate confidence intervals than the normal distribution. Most standard error calculators output the SE value itself correctly, regardless of sample size; the adjustment for small samples occurs when you multiply SE by a t-score rather than a z-score to build confidence intervals.
Related Articles

Calculate cubic feet instantly with our free volume calculator. Enter length, width and height to get accurate cubic footage for any project.
Use an age calculator and Birthday calculator to get exact ages for forms, school cutoffs, plans, and leap-year dates, with fewer entry mistakes.

Use our free Molarity Calculator to find solution concentration instantly. Learn the formula, solve examples, and avoid common chemistry mistakes.
Discover the best scientific calculator online for fast, accurate math. Solve trigonometry, algebra, calculus & more free, no download needed.